the goal:
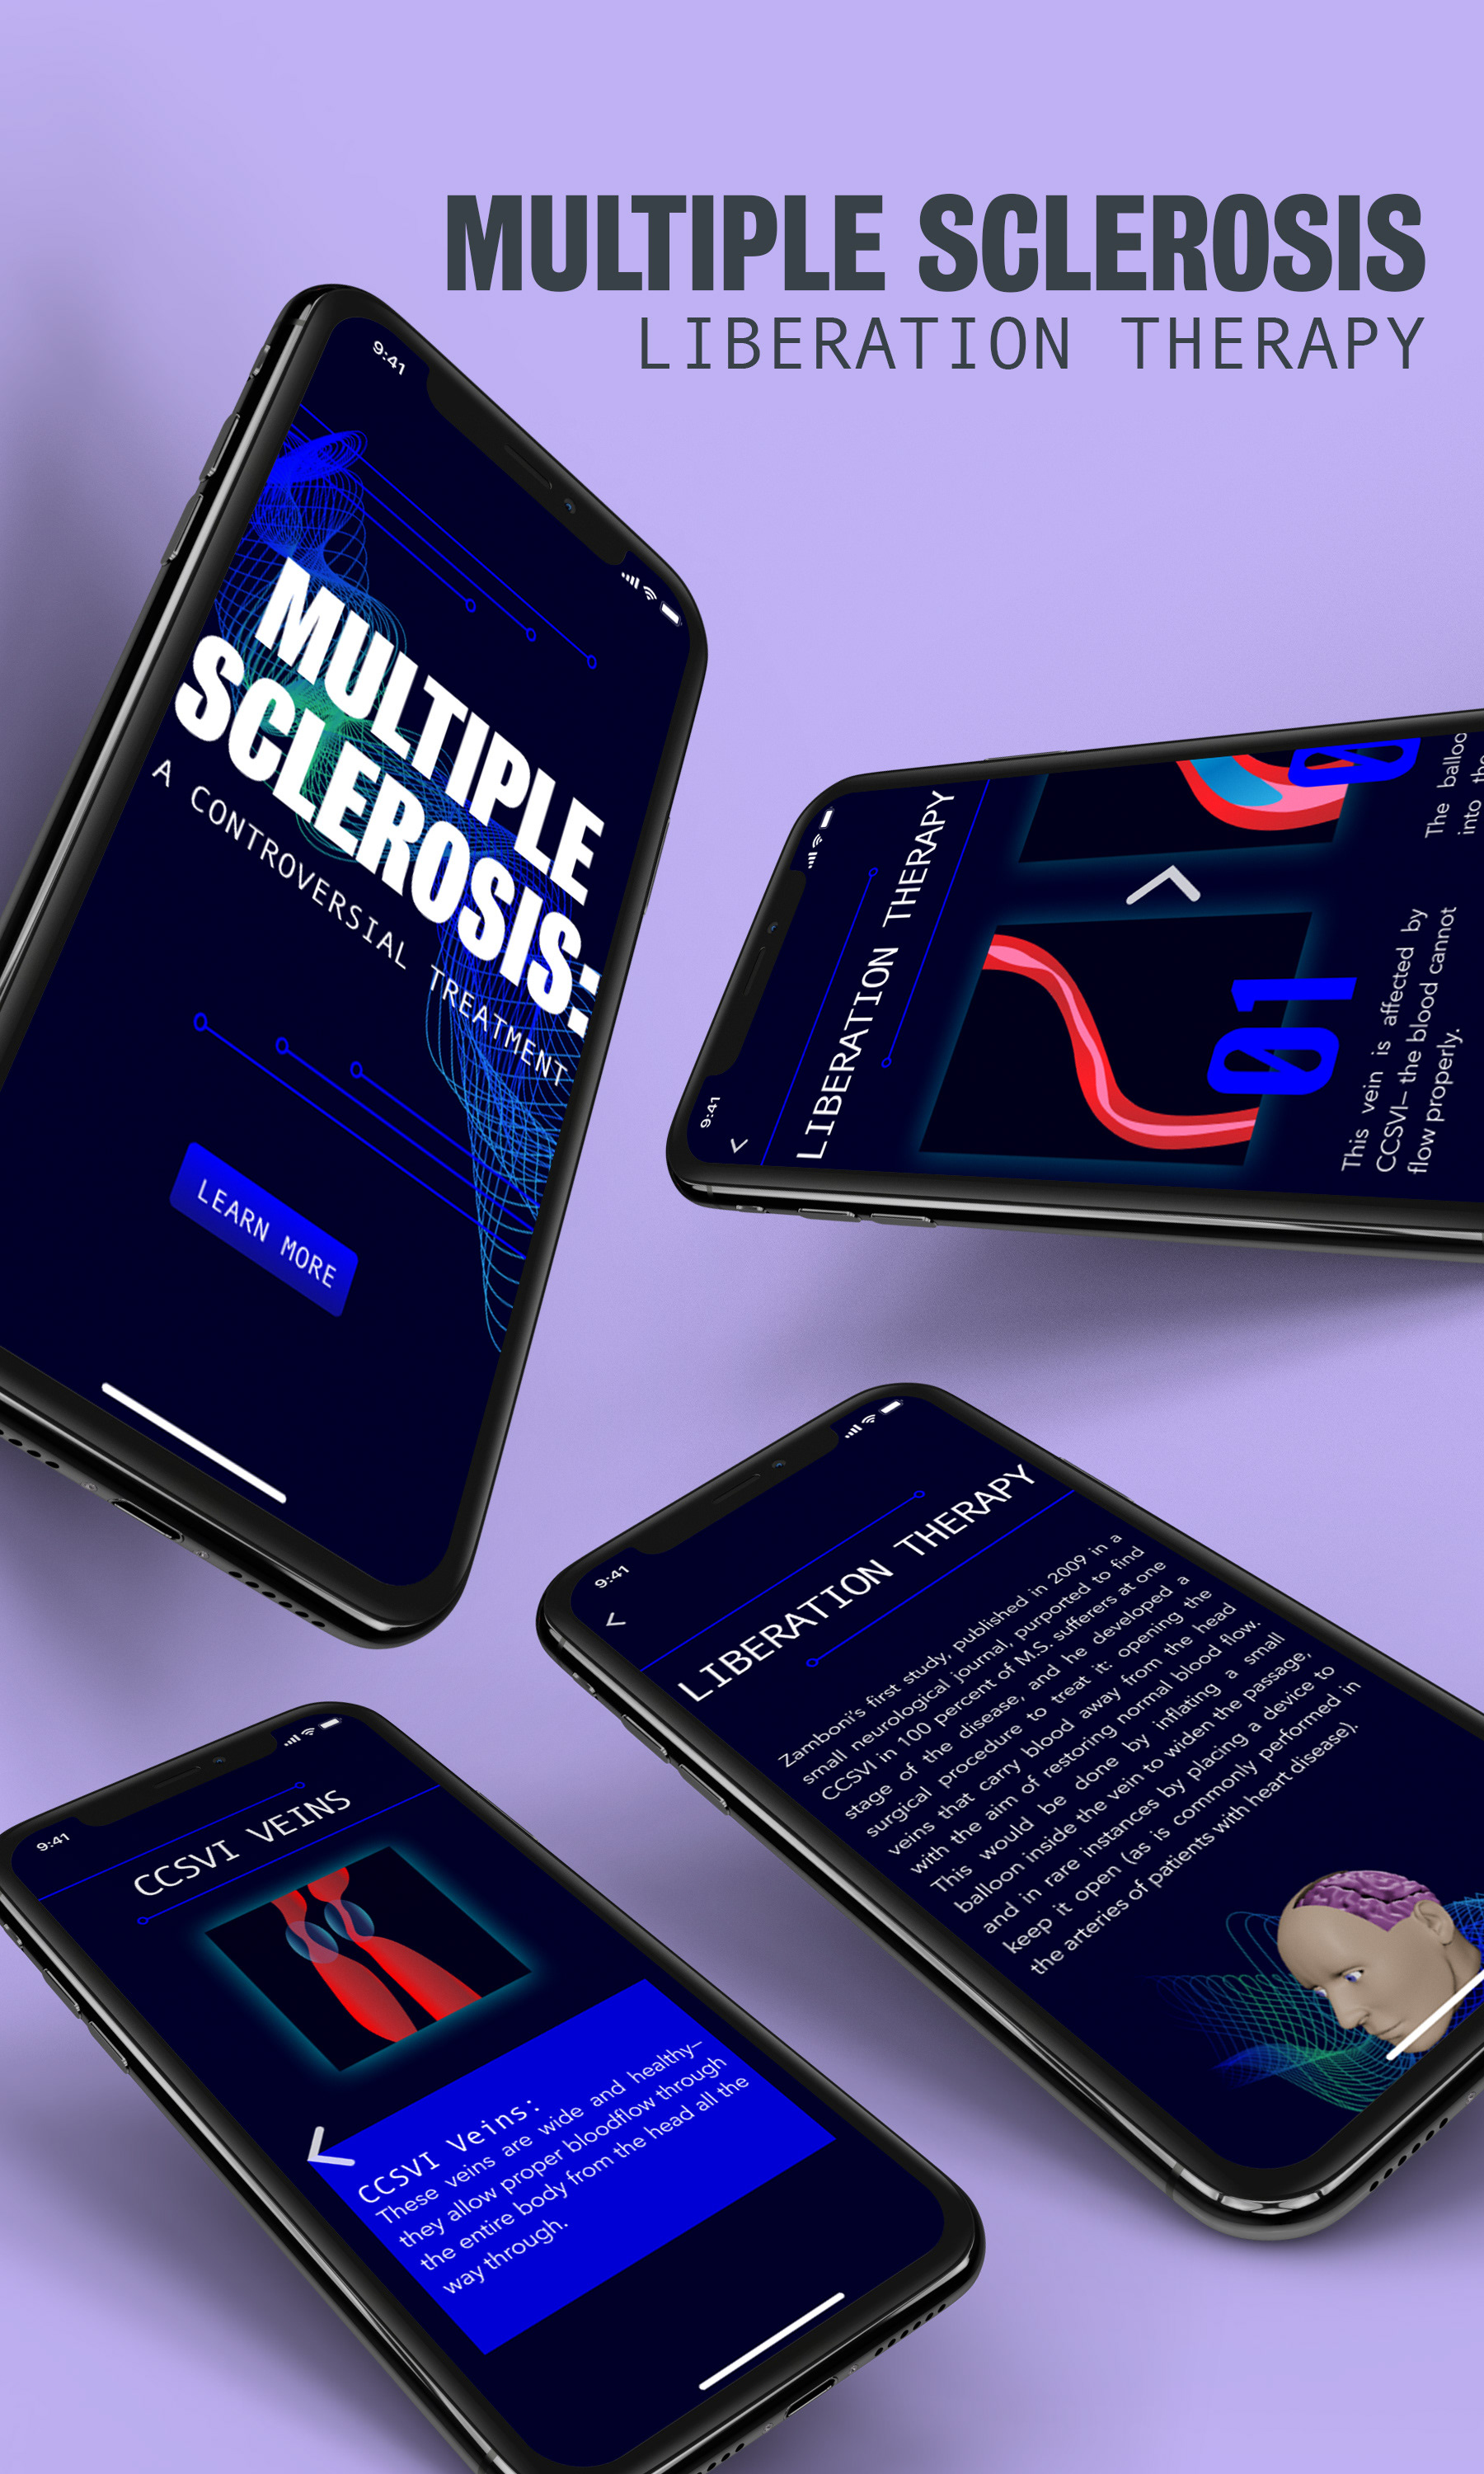
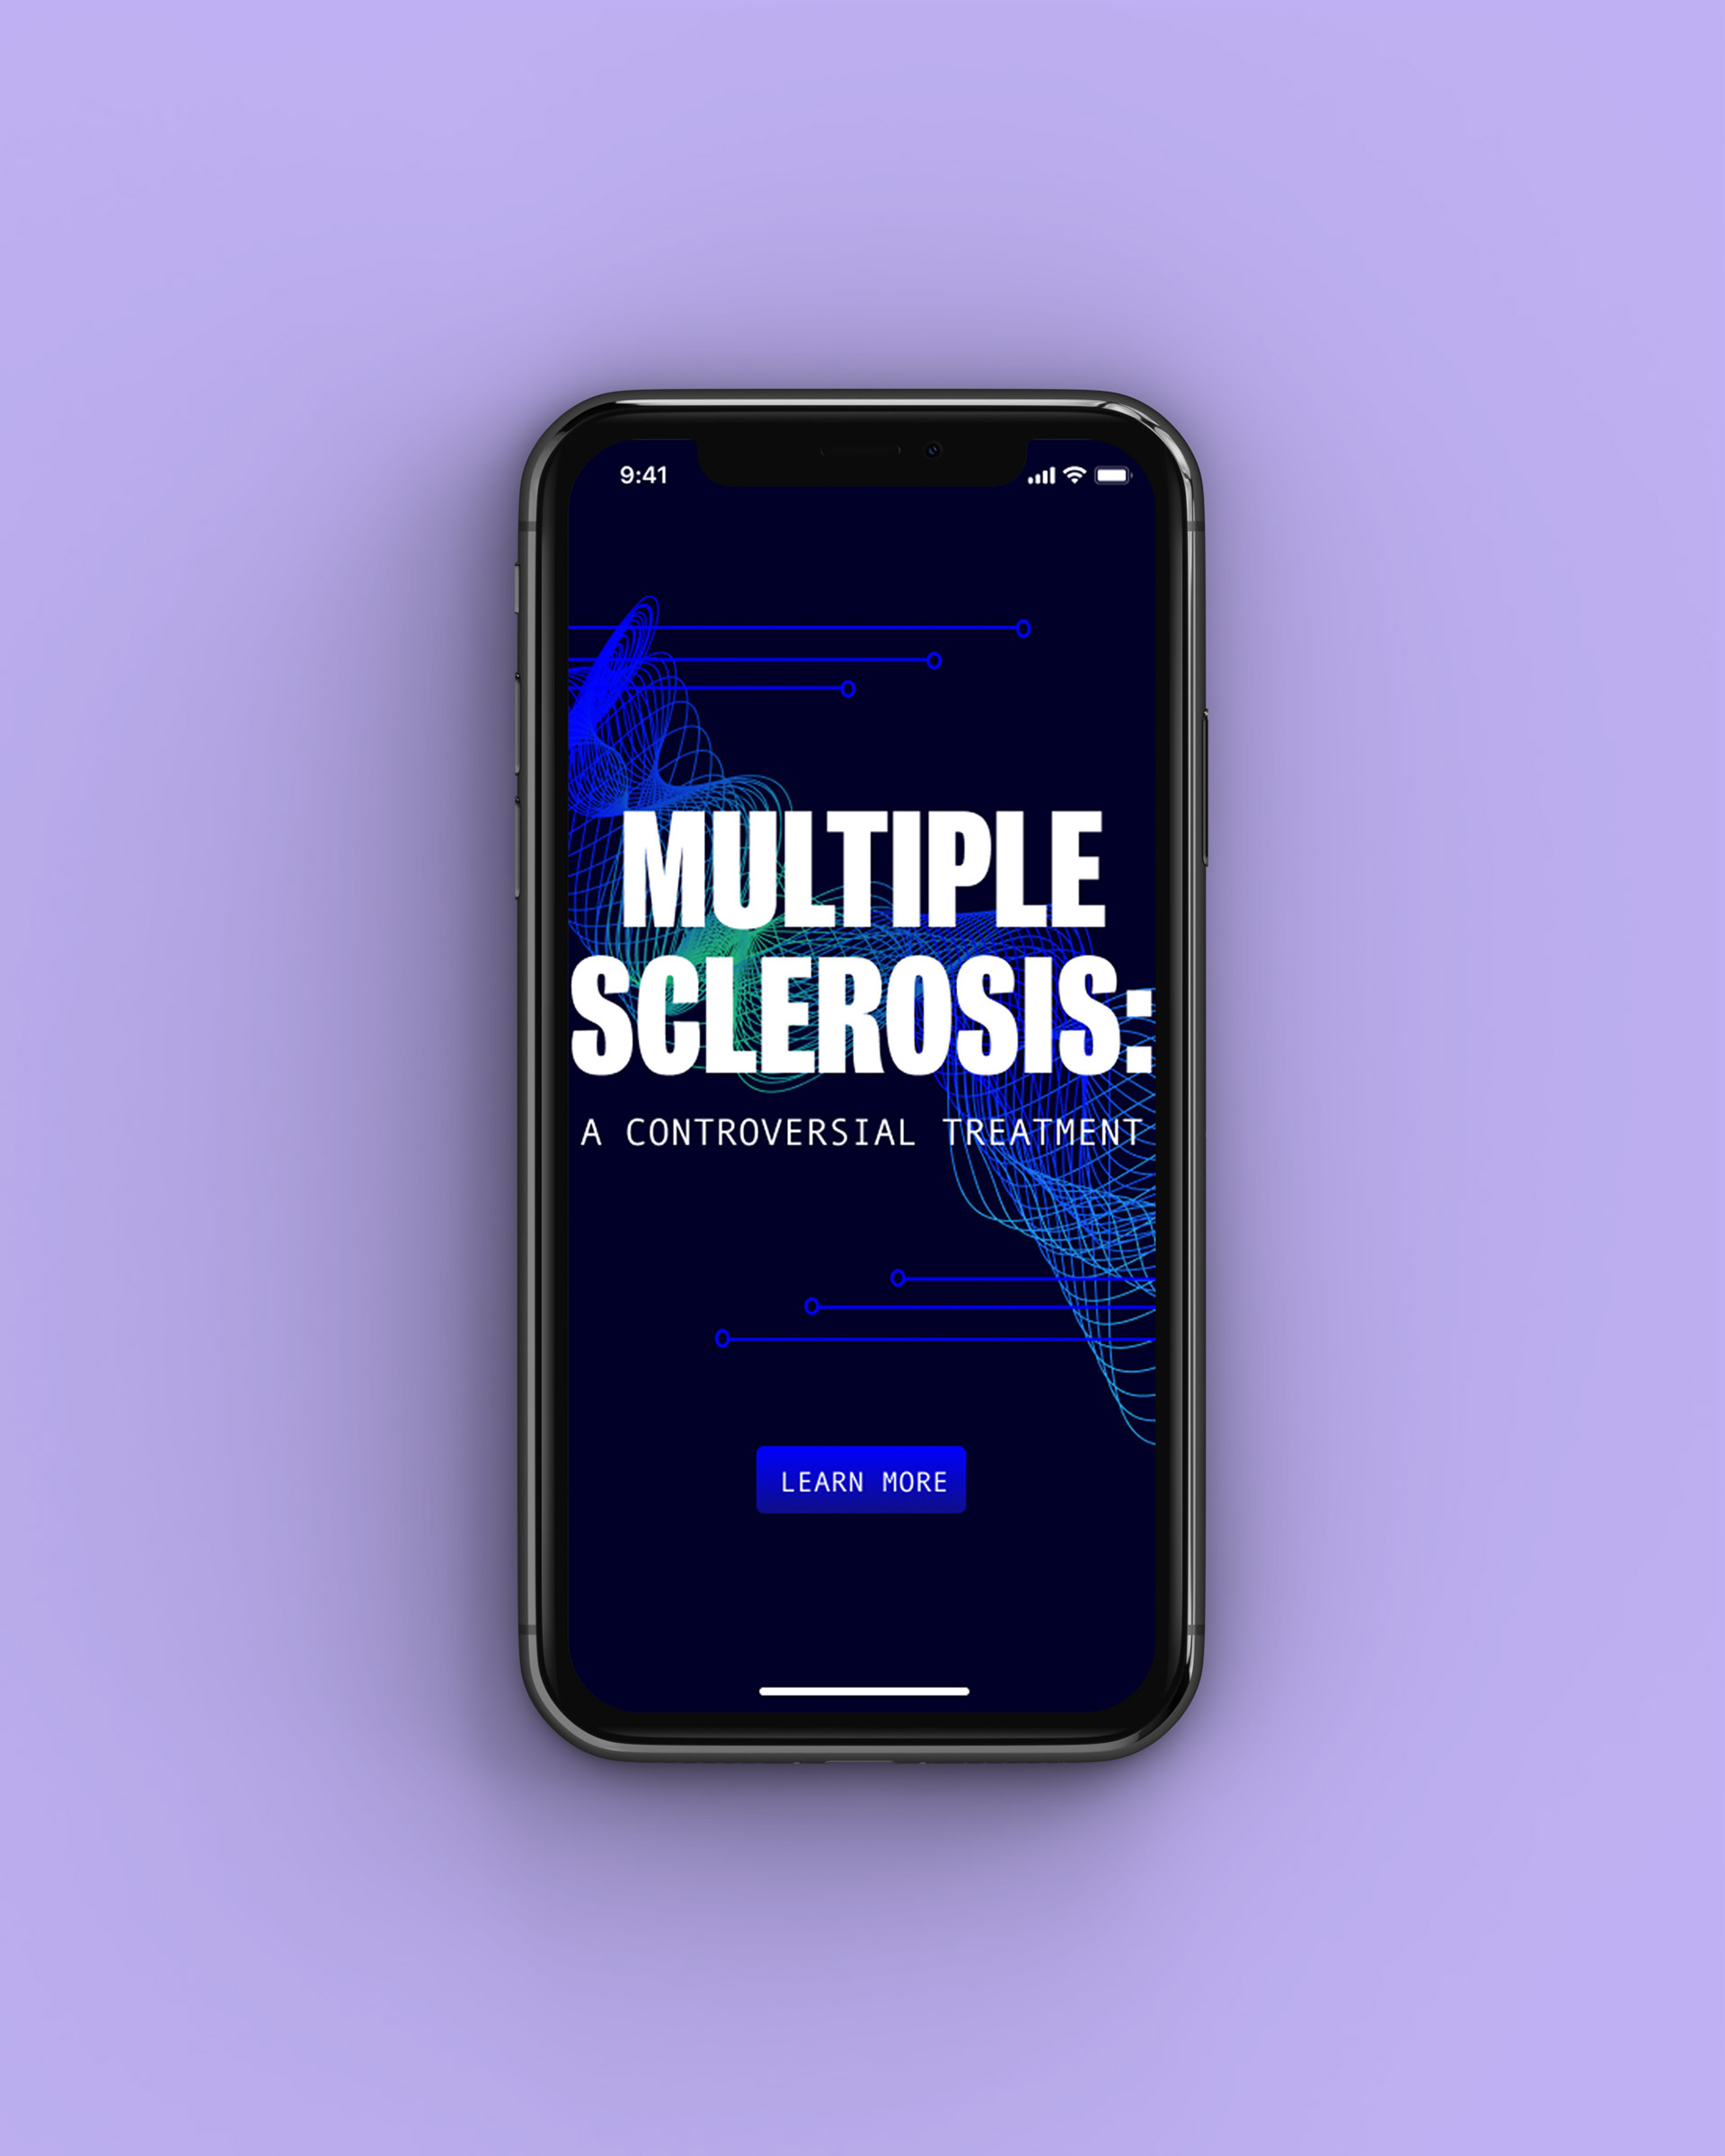
The assignment was to create a data visualization/infographic of a sentence that was beyond comprehension for most people, including myself. My sentence had to do with Liberation Therapy and how that takes place and to represent that information clearly and in an effective way. I chose to do an infographic format, a video animation, and an app.
the sentence:
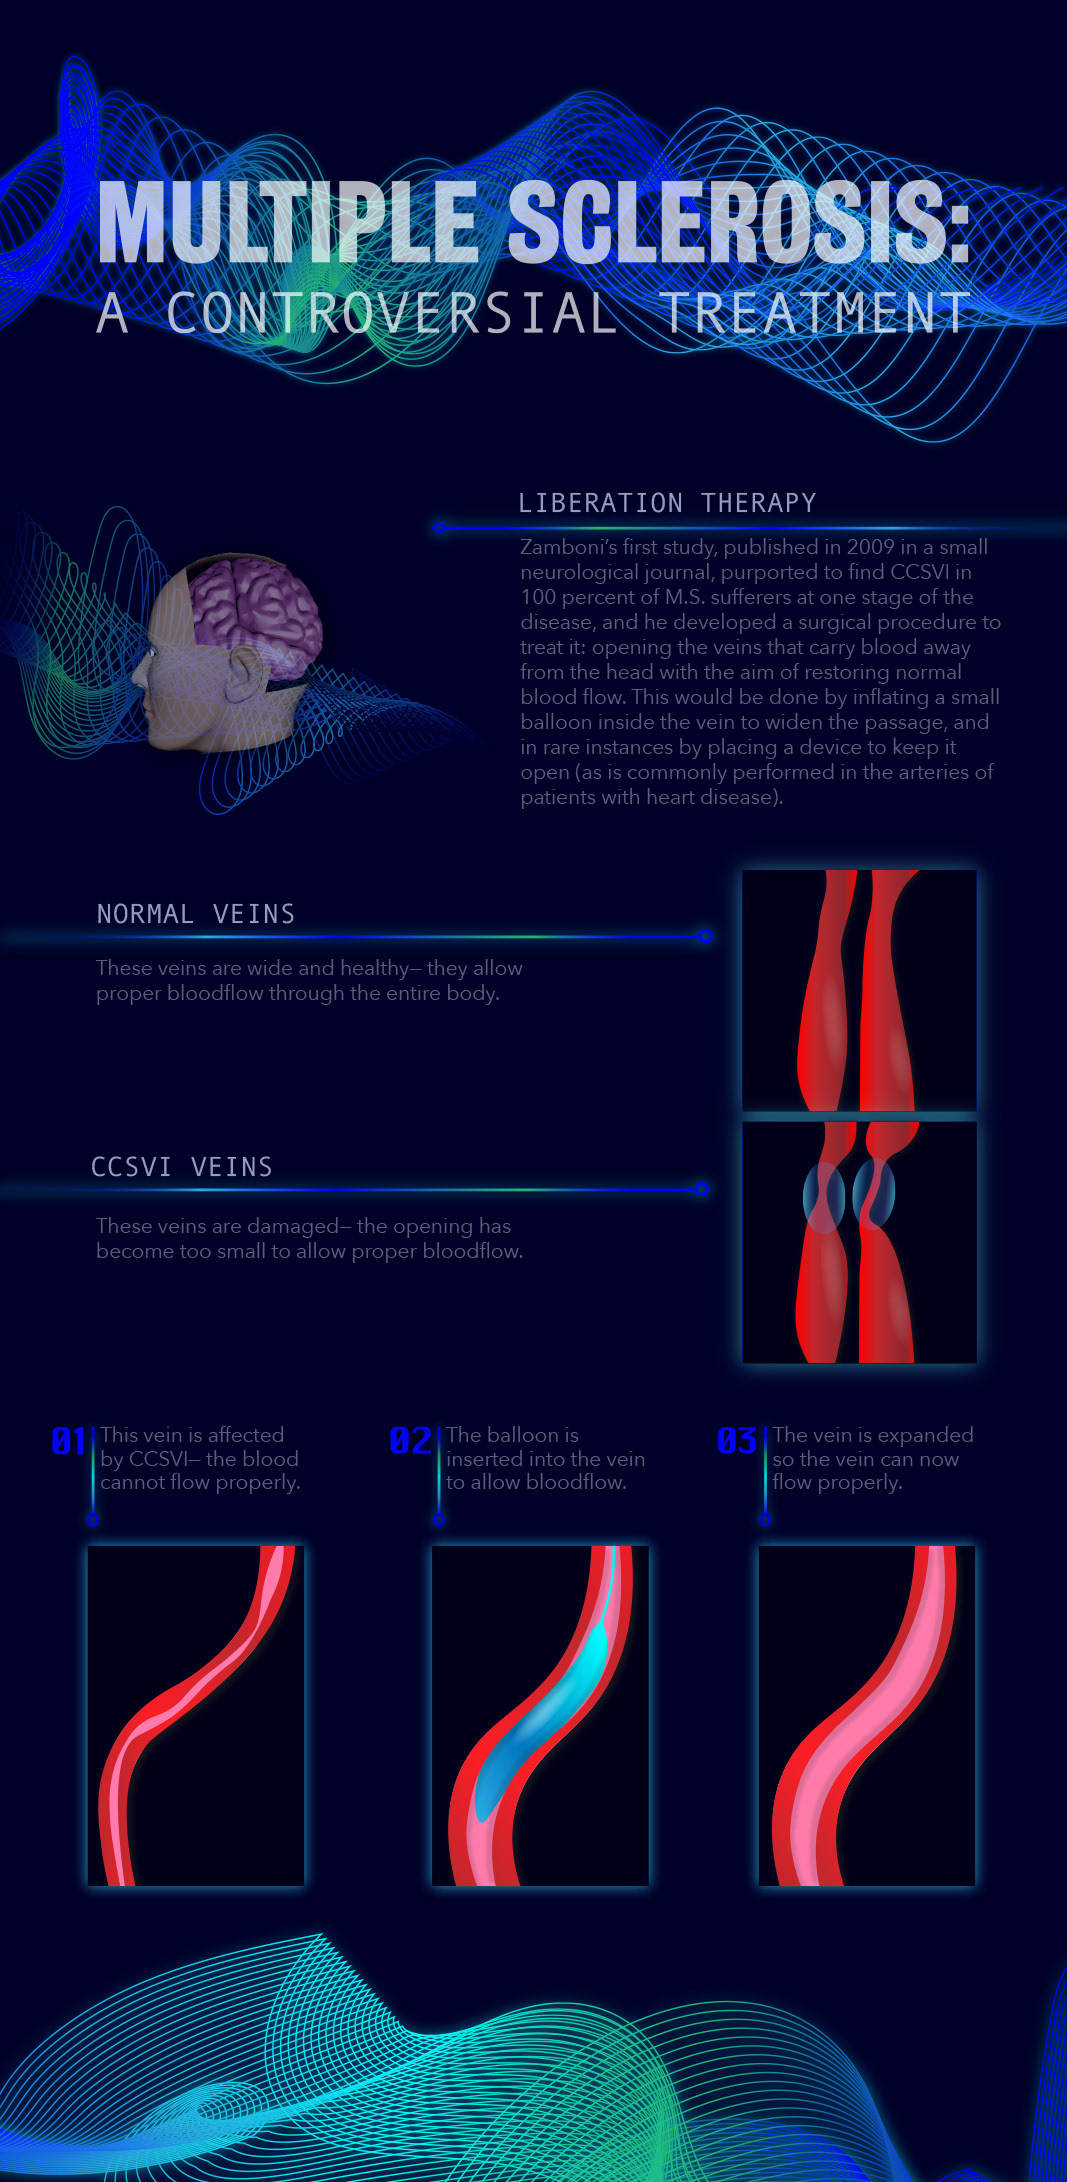
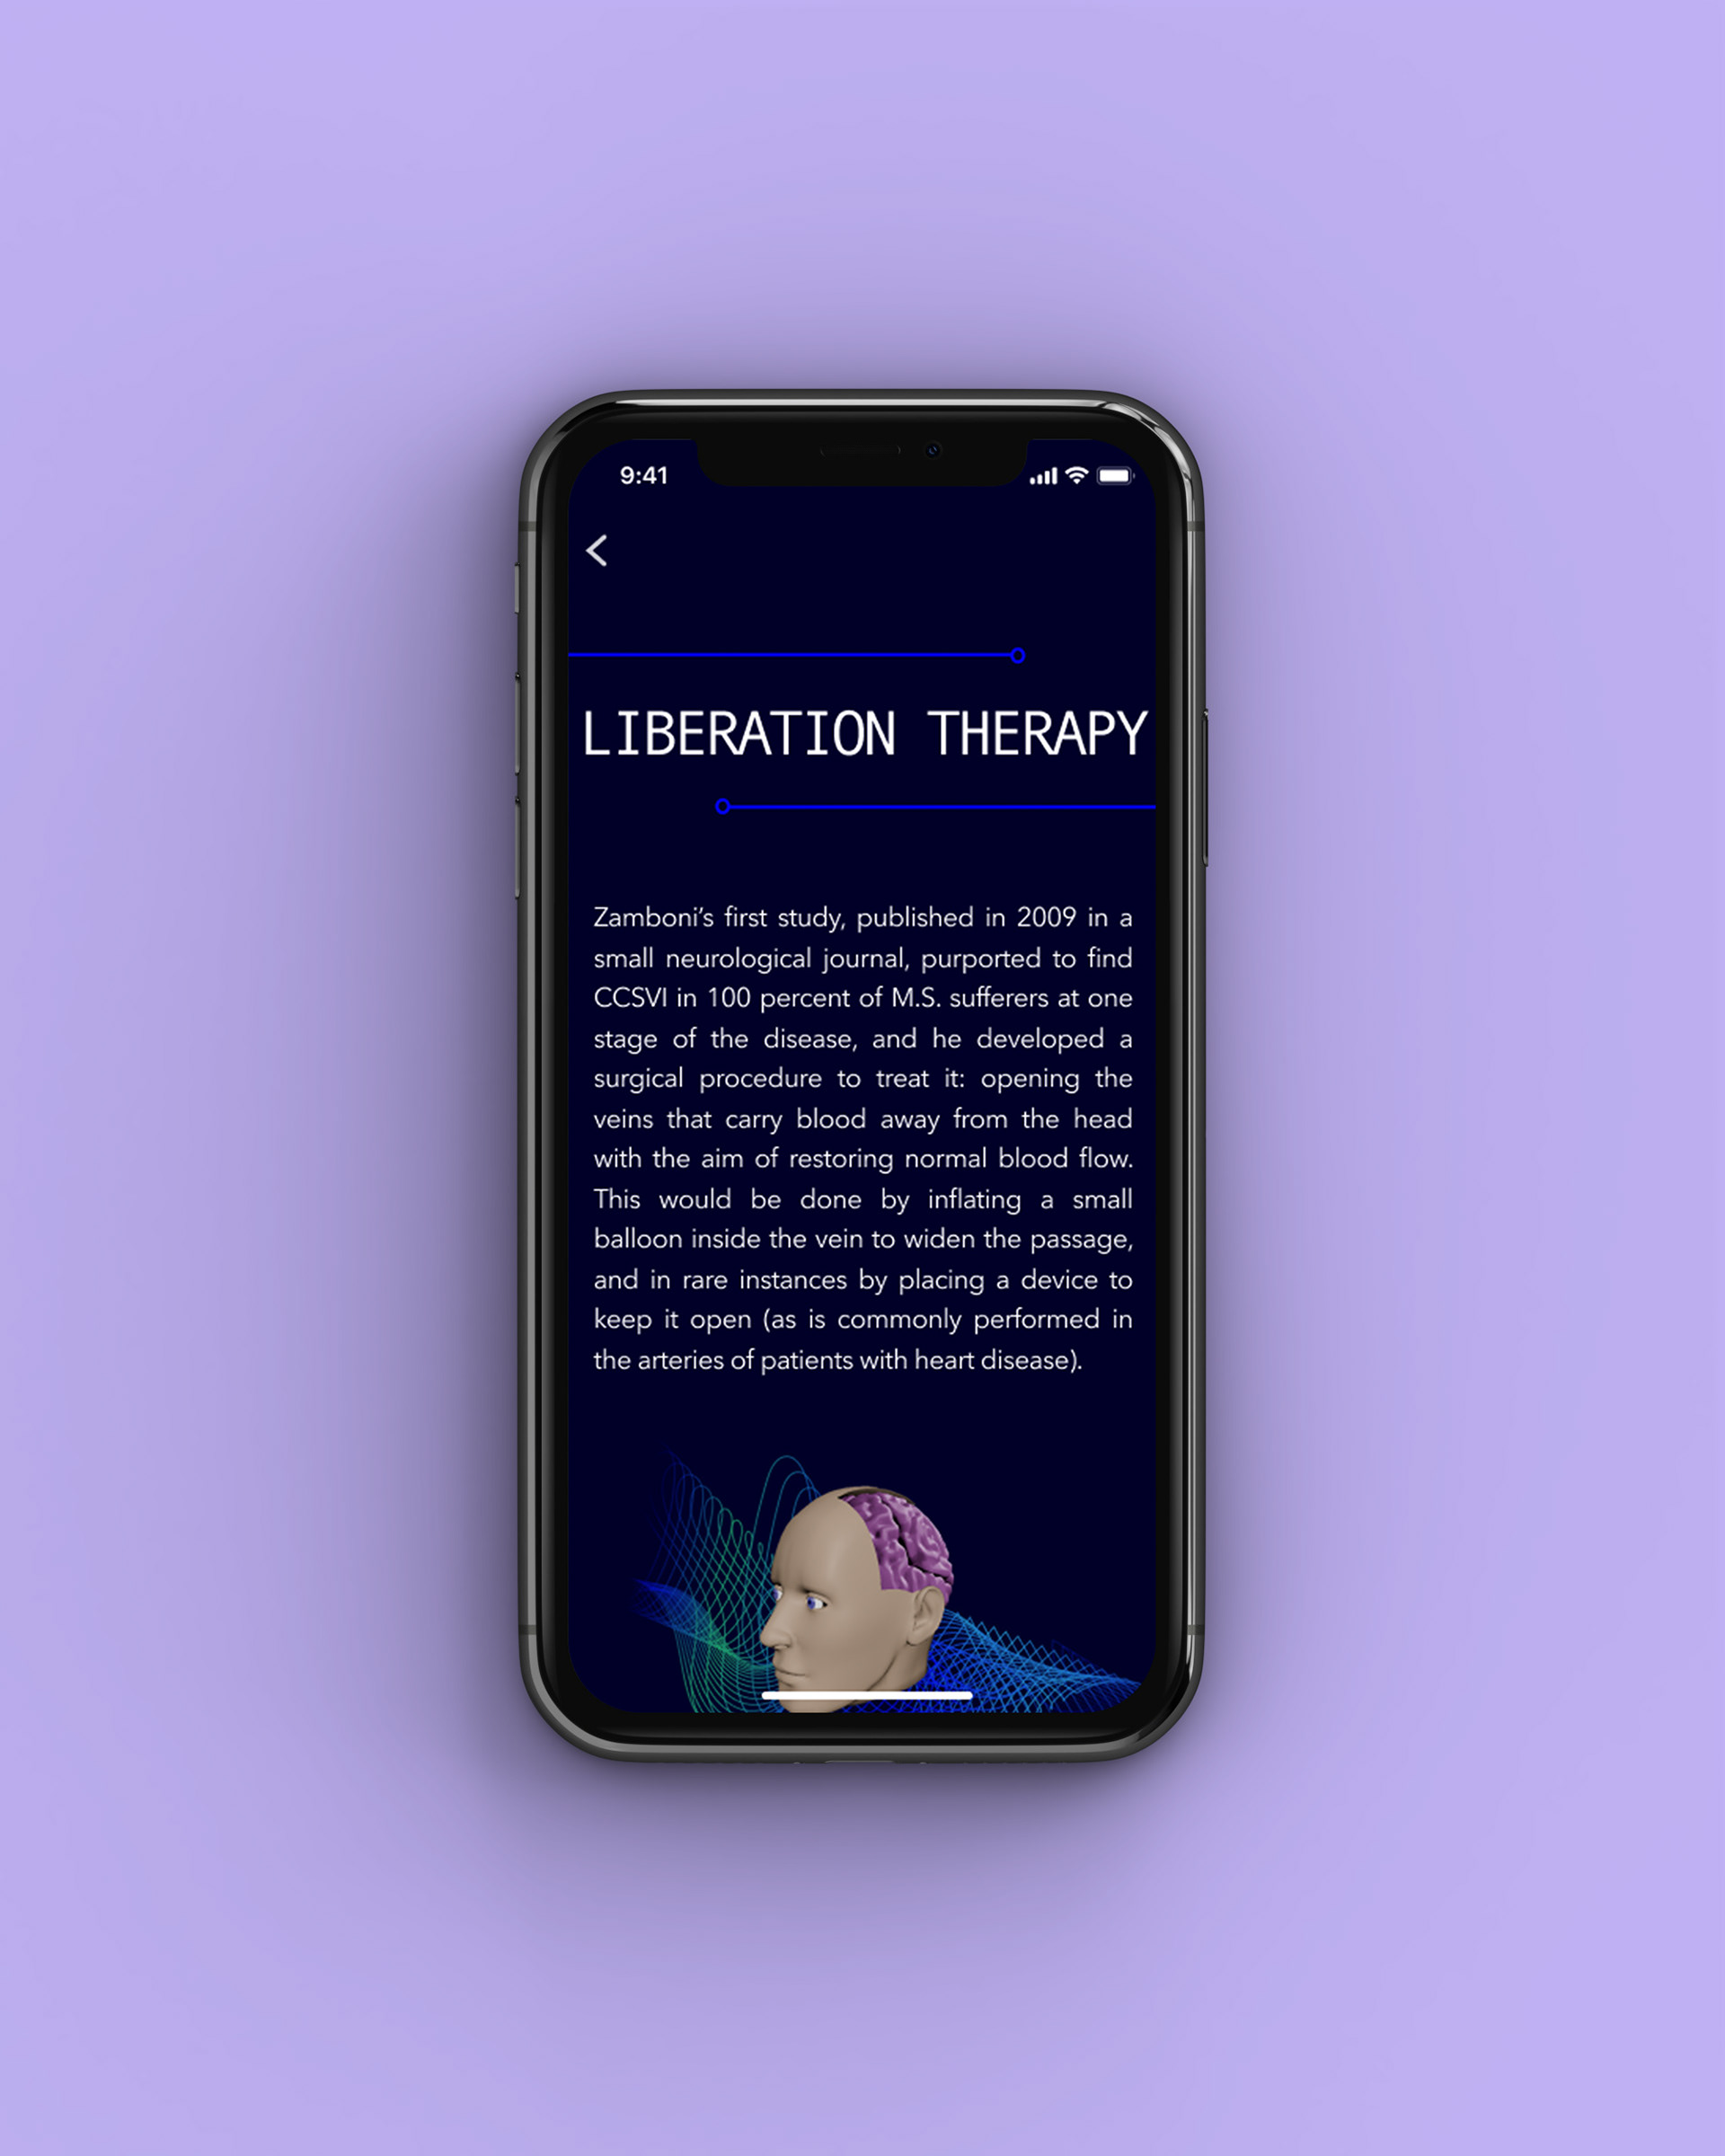
"Zamboni’s first study, published in 2009 in a small neurological journal, purported to find CCSVI in 100 percent of M.S. sufferers at one stage of the disease, and he developed a surgical procedure to treat it: opening the veins that carry blood away from the head with the aim of restoring normal blood flow. This would be done by inflating a small balloon inside the vein to widen the passage, and in rare instances by placing a device to keep it open (as is commonly performed in the arteries of patients with heart disease)."


the motion graphic/animation:
the infographic: